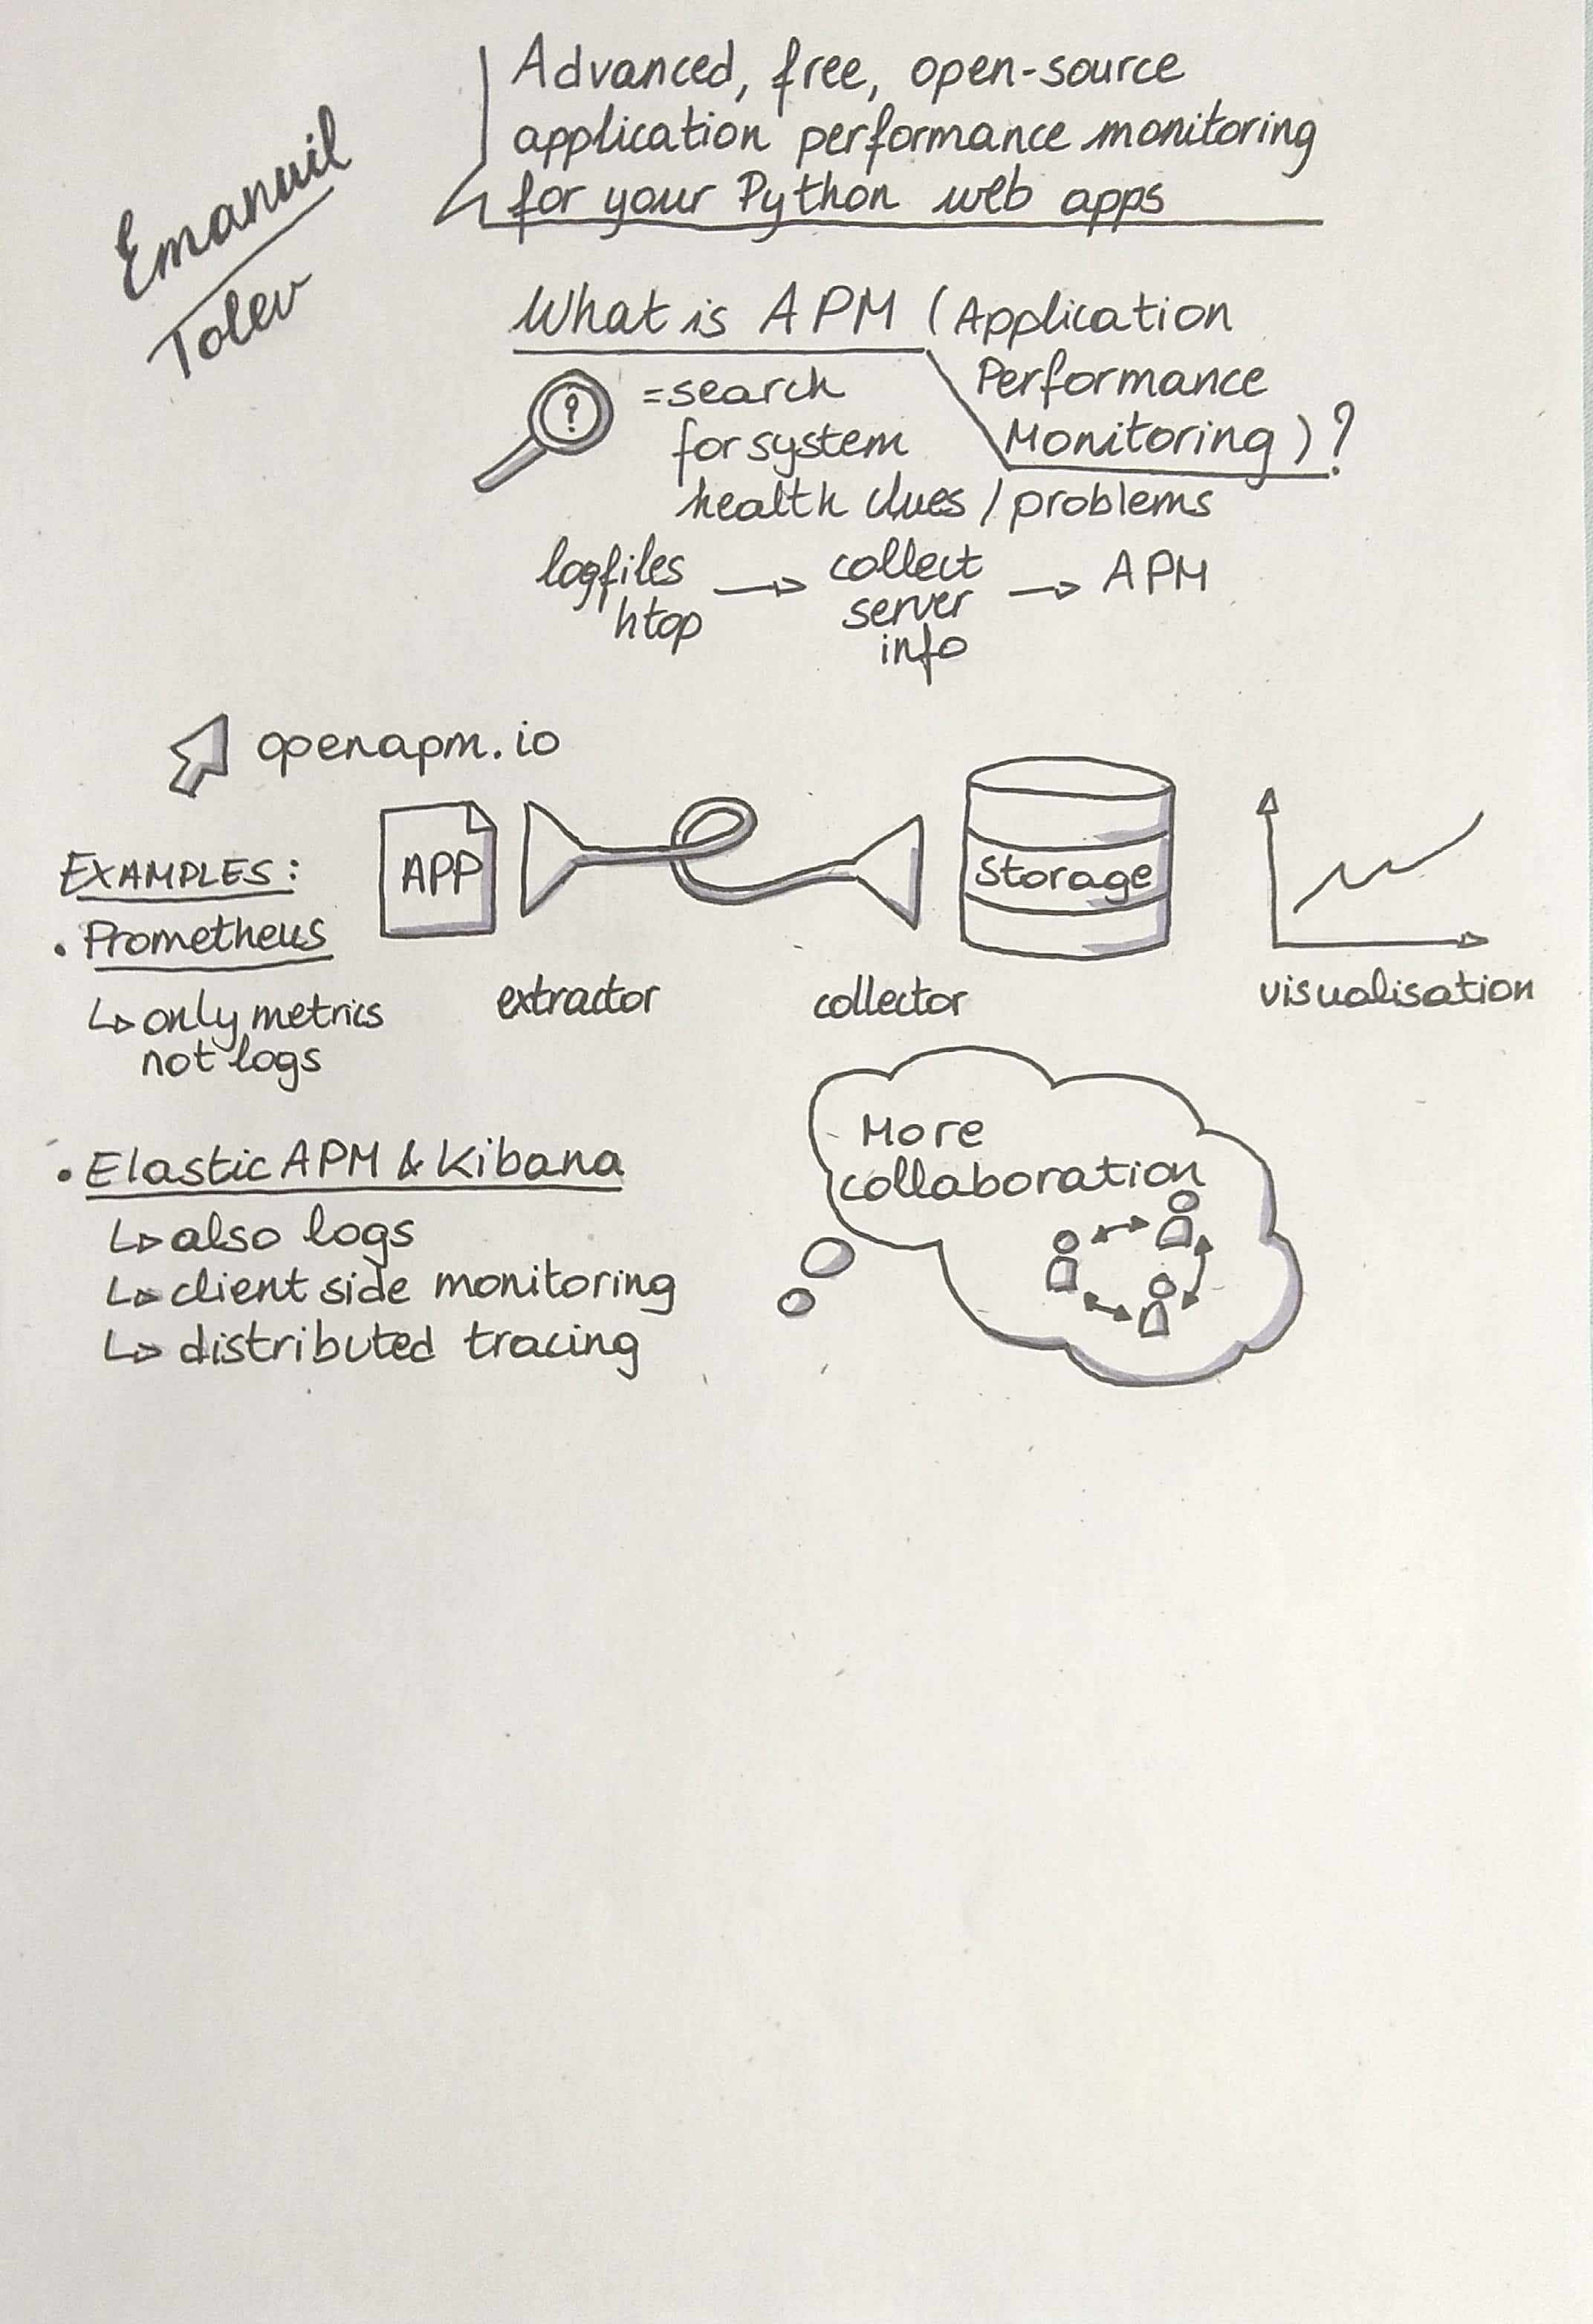

In this talk and technical demo we’re going to walk through a minimal example Django web app, simulate traffic of varied intensity, and monitor the entire system as well as peek deeper in the app.
It is 3am. Your phone rings with a special tone - the systems propping up your employer’s or client’s website are down. You open your eyes and groan, fumbling for your laptop. You’re used to the system’s worst problems, you have an idea what it might be. It’s slow going while you manually check if every component is working. You go back to bed in an hour, having written up a few of the most important details and brought the website back up. Hooray!
However, at 6am you get another call. You sigh and fix it. Then another at 7am, and at 11am. A few days later the outages repeat. What is going on?!
There are types of problems that can’t be solved purely through experience and knowledge of a system. You need deeper monitoring data than “% CPU” and “RAM free” to resolve them. Worse still, there are multiple components involved with failures in one masking a true underlying cause in another, like a slow loading page masking a slow database, which in turn makes you wonder what queries it’s really answering. In this talk we’re going to have a look at how you can monitor small to medium projects to really understand deeper problems at a glance.
The talk will pick specific solutions from various vendors as well as open source for different parts of the problem.